Click to expand the dropdown list
AI-powered Meteorologist's Assistant
AI is changing how work gets done. One of the missing features in the MeteoApp, was a dedicated description section providing brief summary of the current weather condition for each city. In this case, the real challenge was not adding the description to the HTML, but keeping it updated frequently enough to reflect changing weather conditions. With the evolution of AI, implementing such a solution has become easier than ever thanks to LLM models. They are especially useful in such situations where dynamic changes of underlying data produces obsolete conclusion, making the content outdated if not revisited. Despite the concerns in using LLM models for making data-driven desicions, this is one of the advantages that AI agents could bring. I've ironed out this problem with a very basic solution, so that my meteorologist assistant works 24/7 on weather summary corner, ready to update the content on user's demand. >> MeteoApp
Air quality measurements
Each winter, air quality deteriorates as temperature fall below zero, which may have serious impact on health and well-being. Therefore, I recently intergated air quality measurements into the MeteoApp, sourced from official GIOS monitoring stations located across Poland. I needed to bring them into a common hourly intervals and plot them against city, which perfectly fit into the weather data chart. This gives clear outlook on the trend, facilitating comparison among the five most important air pollutants, such as PM2.5, PM10, O3, NO2, SO2. Combining this with the weather data collection is a step towards enriching the environmental datasets I use in my lab for getting environment insights.
Leveraging microservices architecture
I finally had some spare time to rebuild backend architecture from scratch. Something I'd been planning for quite some time finally has come into fruition.
If you visited this site last year or earlier, you might have seen certain sections available on the site served content hosted on external cloud providers. Although cloud computing gives planty of advantages facilitating data storing, availablility and scalability, it wasn't a good solution for the use cases of this site. Keeping services disperesed across multpile cloud providers was bringing unnecessary complexity in managing of these components. There is a significant differece in deployment, maintainance workflows and syntax between AWS services, Heroku or Google Cloud. I decided consolidating all off those services into microservices-based architecture keeping them all together with easy access and management. This has not only lowered the costs related with cloud computing but also introduced more flexibility. Monitoring and deployment of each services has become simpler and independent of one another.
The MedC App can be useful in getting detailed informations and characteristics on medications
If you are seeking for detailed information about specific medicine product, this simple app could be useful. It derives information about any drug referencing its EAN or PC number and downloads its characteristic or leaflet directly to your computer.
To ensure smooth operation, it is necessary to download the package to your local file system, but without any installation. Reports obatined through the app support only Polish language.
This is designed to be a demo version. At thist point I don't anticipate any improvements to this app although I might rebuilt it to a web app in the future. For seamless operation, it is necerrary to download the package to local file system from where it can run. No installation on system is needed. Just make sure you have Windows 10 or higher with a firefox webbrowser.
Exploratory data analysis with anomaly detection
Similarly as missings in datasets, anomalies occurs every so often especially when you are dealing with big data. These kind of observations leads to pose scores of complications in further modeling and could mislead final statistical inferences. It other words, it's impossible to create well performed statistical model or any good research without this essential step in process of analyse. Many solutions exists, it can be erased or changed but this may tamper the data. Depending of purposes of use the data choosing and applying adequate methods can be helpful, however care and precision are highly required. Some of them are based on overall assumptions, others are more specific, more depends on structure or content of the dataset and goal of diagnosis.
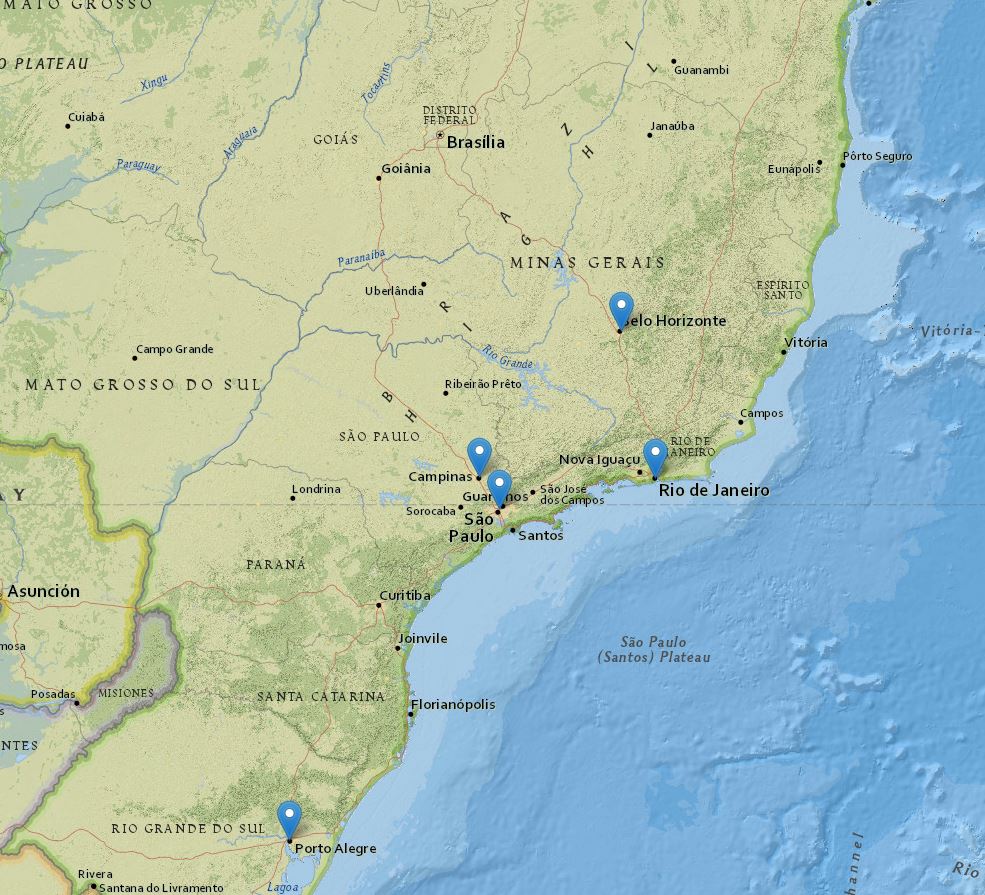
I created an example of exploratory data analysis with one more common method and one less common of detecting outliers. This was performed on data containing Brasilian houses to rent. The map below points on cities in with the analysed offers are located.
The analysis was perfomed on Databrick's platform, leveraging Spark's distributed processing power while handlling computations. All has been done in Python and a bit of Scala language. In this example, I used two methods for detecting outliers was an interquartile range and the isolation forest from sci-kit learn library. The first is pure statistics method adn the second IsolationForest is a tree-based model where partitions are created by random selection of a feature at first and then random selection of a value between its minimum and maximum range. Evey major data exploration step has a short decription.
Tap on the upper green bar "View projects" and from appeared list choose Anomaly detection & EDA example section. You should get instantly directed to the analysis.
MeteoApp Dashboard
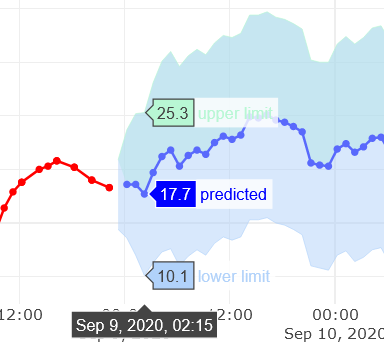
I built MeteoApp to provide simplified weather data information for commonly used environmental measurenemts across the biggest cities in Poland. This was a base to expand the initial concept by creating forecasting model that becames an integral part of the weather chart. It has been implemented to perform forecast calculation on user demand, only then the result is visible. Because of limited resources and computation power consumptuon the model only applies air temperature in Warsaw. Although it never meant to compete the ones created by hi-tech companies and serves mainly for demonstratative puposes, the latest upgrade of the model shows preety good accuracy, yileding more accurete prediciton results.
To open MeteoApp, tap on the upper green bar "View projects" and from appeared list choose MeteoApp section. You should get instantly redirected.
Included locations and measurements
This version include selected meteorology measurements taken directly from multiple sensors installed in the seven biggest cities in Poland (Białystok, Gdańsk, Kraków, Poznań, Szczecin, Warszawa and Wrocław). The measurement parameters are as follows:
| # | Measurement | Unit of measurement | Symbol |
|---|---|---|---|
| 1 | Air temperature | Celsius degree | ℃ |
| 3 | Relative humidity | expressed as a percentage | % |
| 4 | Sum of precipitation | millimetres | mm |
| 5 | Pressure | hectopascal | hPa |
| 6 | Wind speed | Metre per second | m/s |
| 7 | Wind direction | Degree | ° |
Updates and parameters dependencies
Date time used in the App is given for Europe / Poland timezone CET/CEST. Data comes from synoptic weather stations located in Poland, administered by Institute of Meteorology and Water Management. New measurements should be present ten minutes approximately after each hour, however once in a while some delays occurs and thus fresh measurement may not be available. To prevent missings on data, new measurement where set to be displayed 15 minutes after each hour.
A datatable contains last 24 captured measurements while main line chart on the right side presents a bit wider time horizon. Parameter selectors like 'measurement' and 'city' has dependencies as shown in graph below.
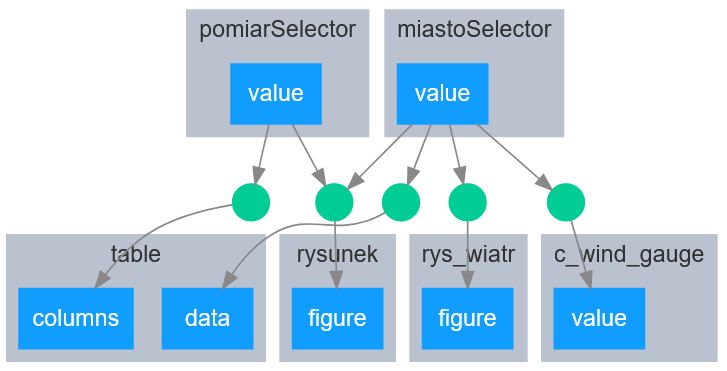
The wind gauge value refers to 'city' selector returning last measurement of wind speed and doesn't appear on the line chart. More deeper outlook of the wind speed and direction can be seen on the polar chart that depicts distribution and wider time horizon.
Please bear in mind that forecast can be display for any weather parameters or cities but it applies only for air temperature at 2m for Warsaw.
World map with daily statistics on Covid-19
When countries ease pandemic-related restrictions that strangled their citizens everyday life for months, people rapidly but unsurely return to their workplace and social life activities. In the times of coronavirus post-outbreak some may forgot about the how dangerous this novel virus is and thus stick with epidemic restrictions as everyone is missing those normal daily life. Are we currently dealing with another wave of the pandemic? You can check it on this map. Just for quick reminder, be responsible, prevent spreading the virus by wearing masks, avoid crowded and enclosed places, keep social distance at least 2 meters away from other person and monitor daily scale of infection in your country.
I've created web map which presents daily confirmed cases of covid19 given for each country. It include indicators like:
- daily amount of confirmed new cases,
- historical daily amount of confirmed new cases,
- number of total reported cases,
- total cases per million citizens,
- total cases of deaths.
To see this map tap on the upper green bar "View projects" and from appeared list choose Covid-19 Map. You'll get instantly redirected.
All indicators are given as yesterday statistics as they are originated from reports of each country and must had been confirmed before. Historical values are presented on graph, click on any specific country marker to turn the view on. The most important part of data comes from Eurepean Centre for Disease and Control (ECDC). Algorithm is providing the data directly from Our World in Data, a great organization which mission is to make data and research on the world’s largest problems understandable and accessible (read more about them here). The Covid-19 Map should be up to date each day between 10:00 and 12:00 CET/CEST.
On the updated version, the actual and latest new cases of covid19 for Poland has been added on the left down corner of the map, to give possible best outlook of current situation.
Ripping through the data jungle
The Data Jungle Analyses is a personal page where I occasionally put projects or articles that I made basically for the learning purposes but also to share working examples, not just plain theory. Apps that I posted on this site have been developed for non commercial use only.
Please be mindful that I run this page in my free time, thus some issues may happen occasinally i.e. outdated content.
If you have any suggestion or want to connect, please find the contact information section on the right side of the page